
Browse Data
Find the entry to view all datasets


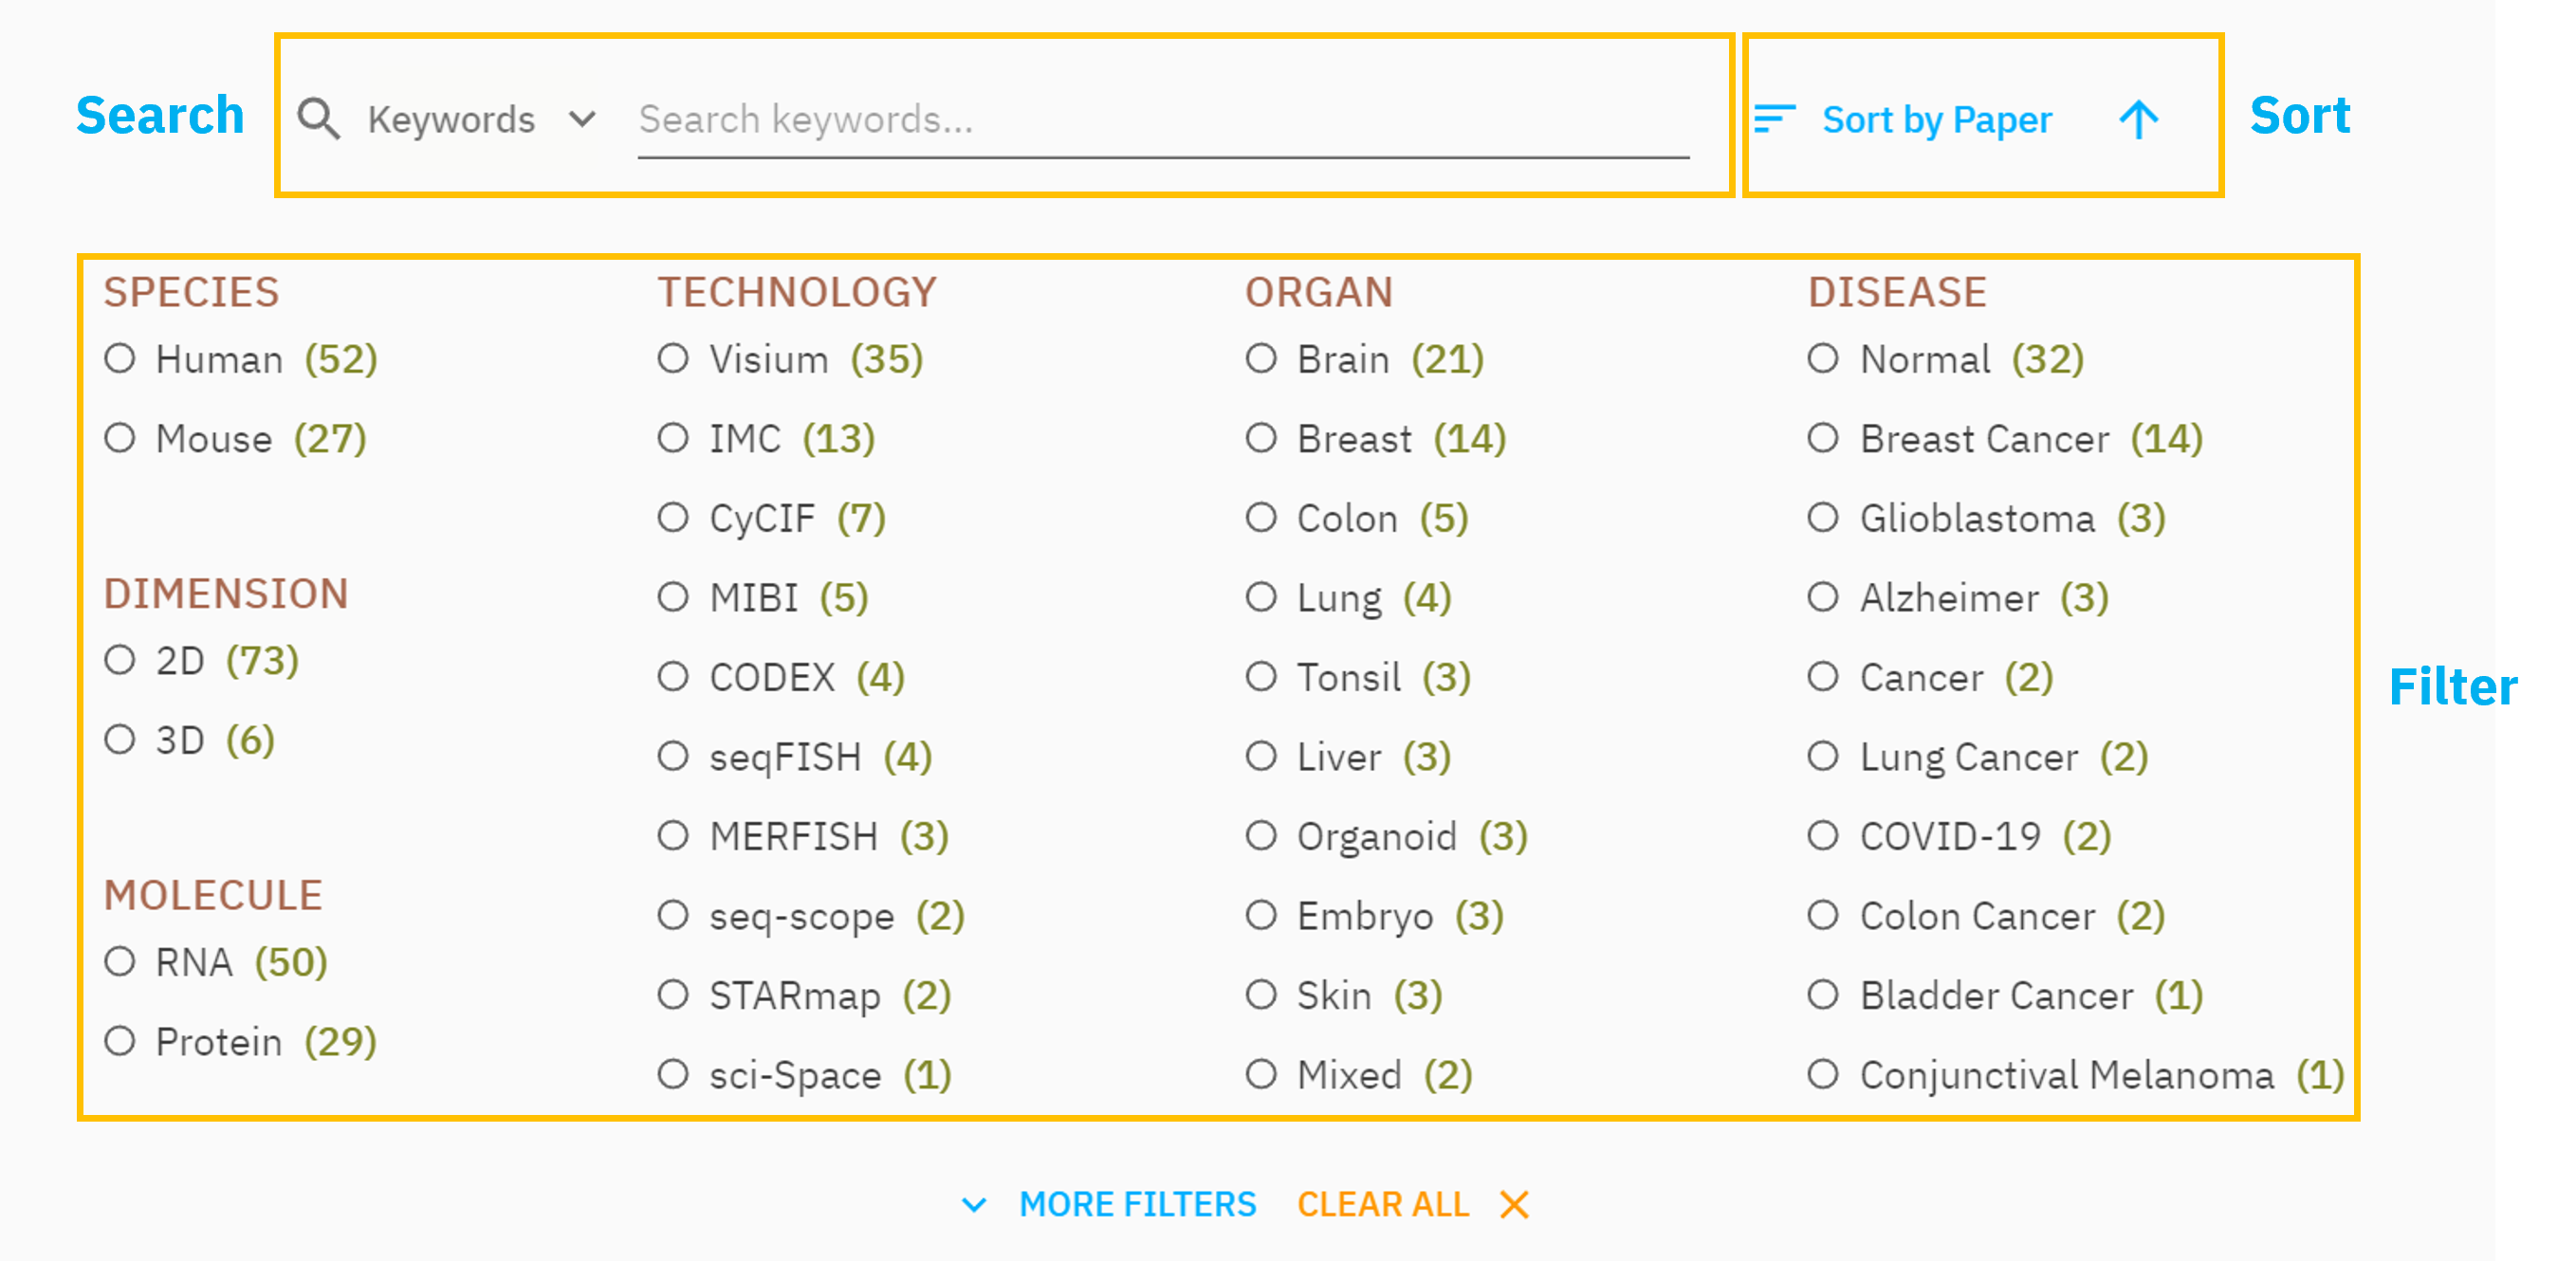
Find your interesting datasets
- Search: You can search by any keywords or search by marker or gene name.
- Filter: Use the filter panel below to select the conditions.
- Sort: You can sort by number of cells/markers/ROI, year or publications.

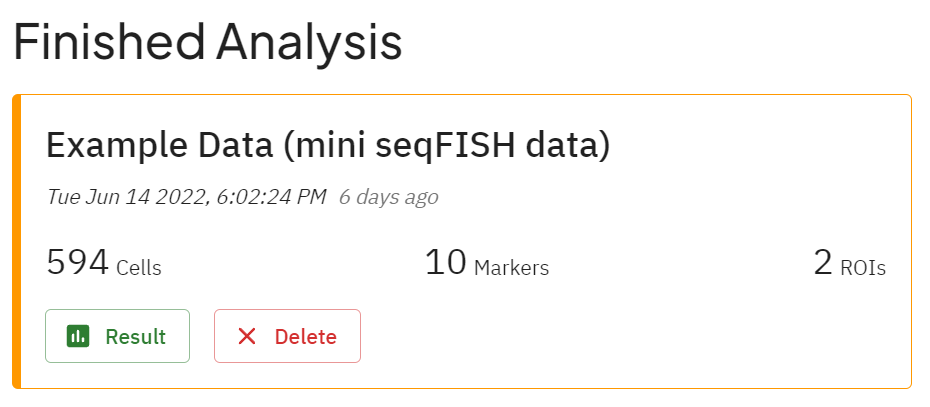
What's in the data card?


Download the datasets
View the data
Perform spatial analysis
Feel free to run all kinds of analysis including advanced spatial analysis. If you don't know what each parameter mean, it's ok to stick with defaults. Or check the for reference. Click on theRUNto run the analysis, the visualization will be automatically shown or updated.
Good to go!
Data Viewer
What each section do?
- Data summary section: Information related to the dataset.
- Select ROI: You can switch between different ROIs.
- ROI Preview: Visualize the spatial distribution of cells and expression.

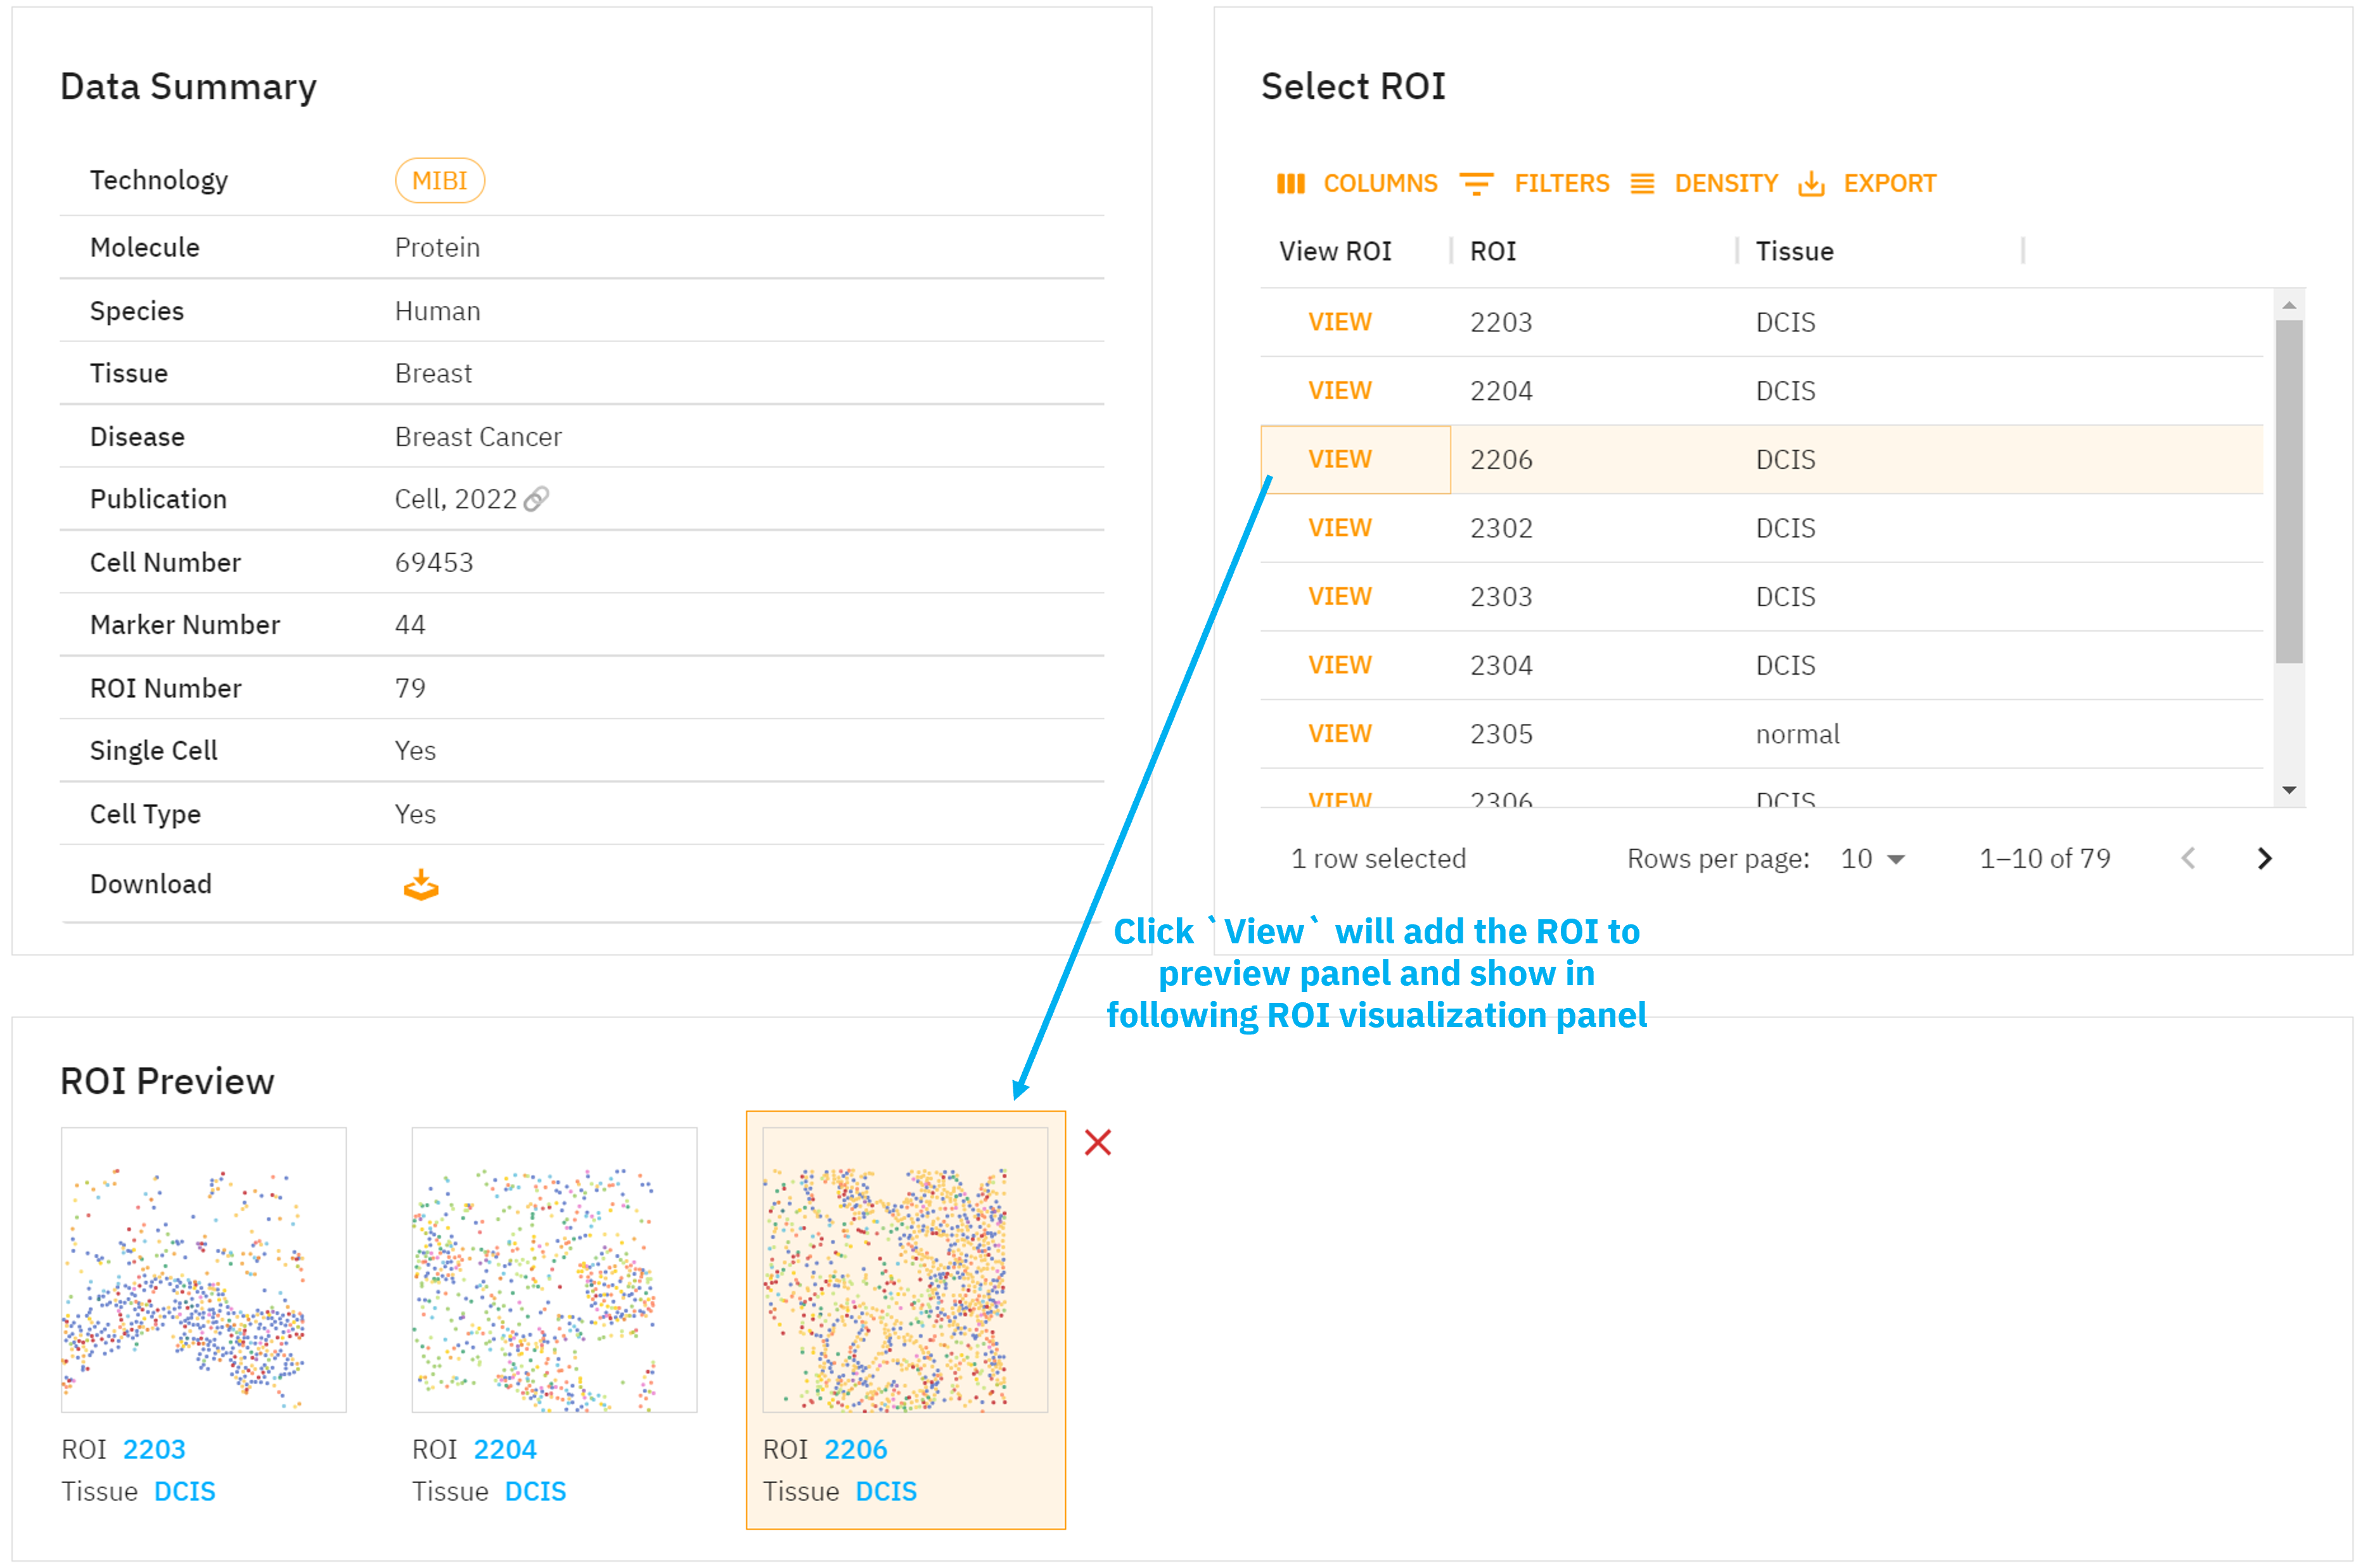
Select an ROI
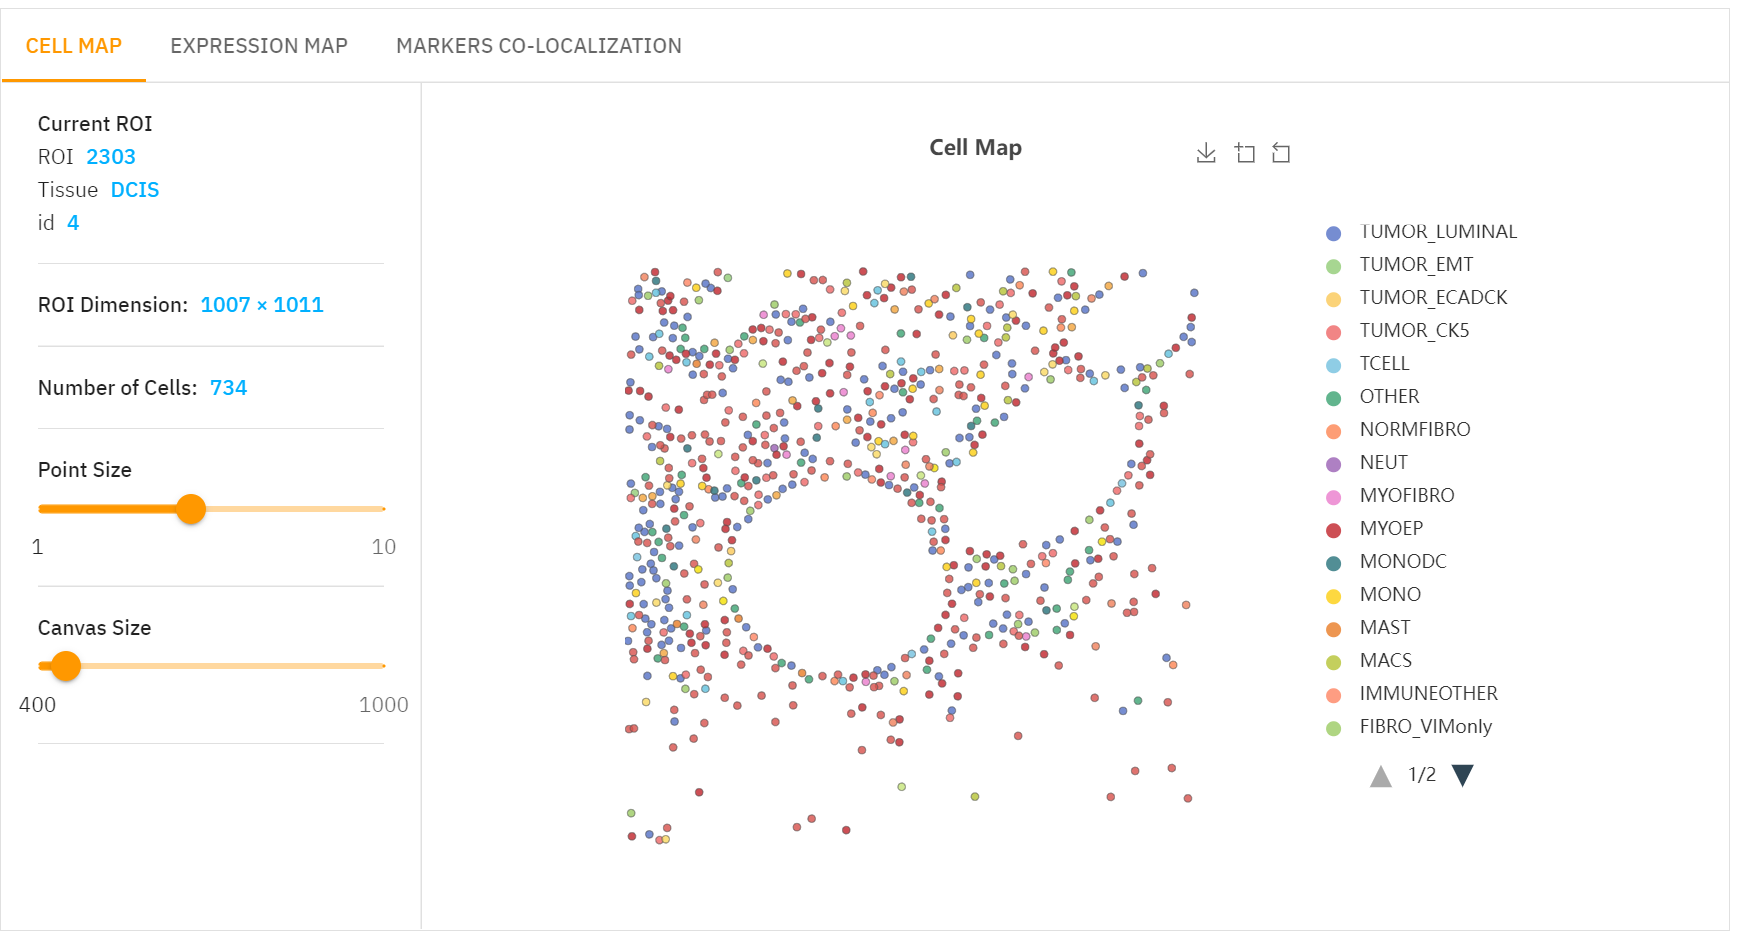
Cell Map

Expression Map


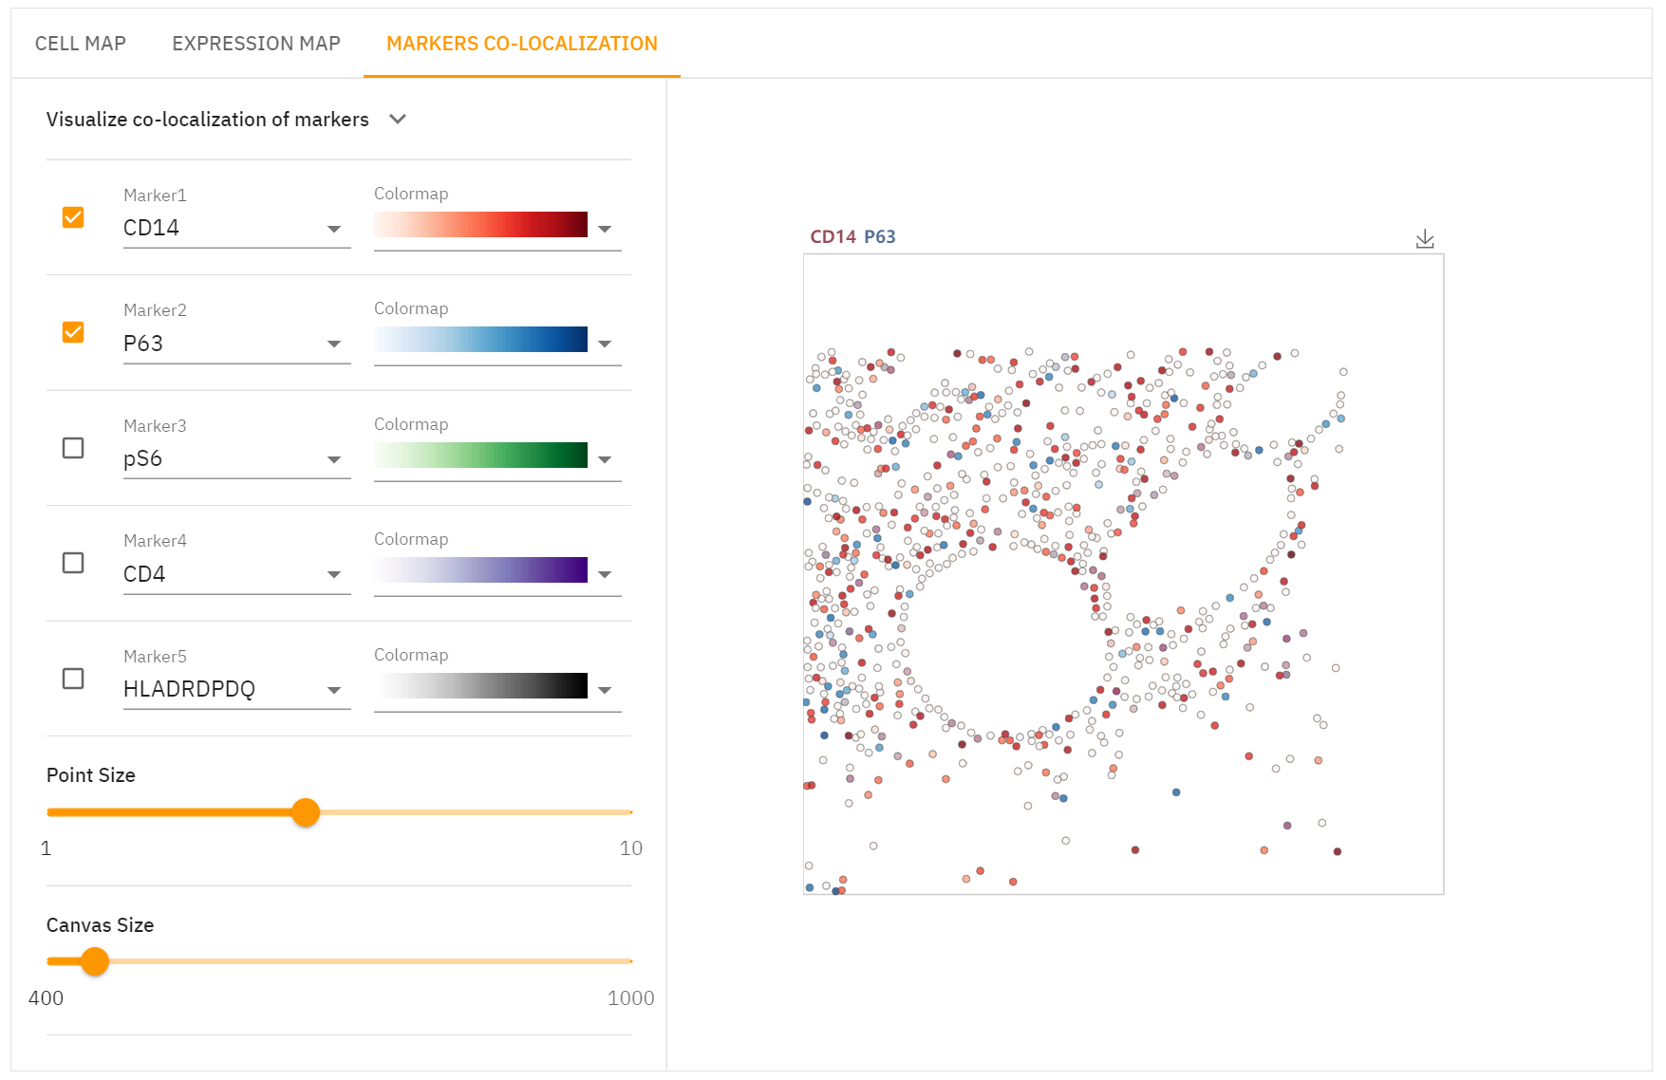
Markers Co-localization

Spatial Analysis
Analysis panel

Prompts in analysis
You likely have no idea what an analysis does. Hence, we provide you with a brief introduction to each analysis. Click on the expand arrow to view the details of each analysis. You can hover on theto get a tip if you don't know what a parameter does. Don't want to mess with your brain? Stick with default values is always great.
Run the analysis
Click on theRUNto run the analysis, the visualization will be automatically shown or updated.
Analyze Your Spatial Omics Data
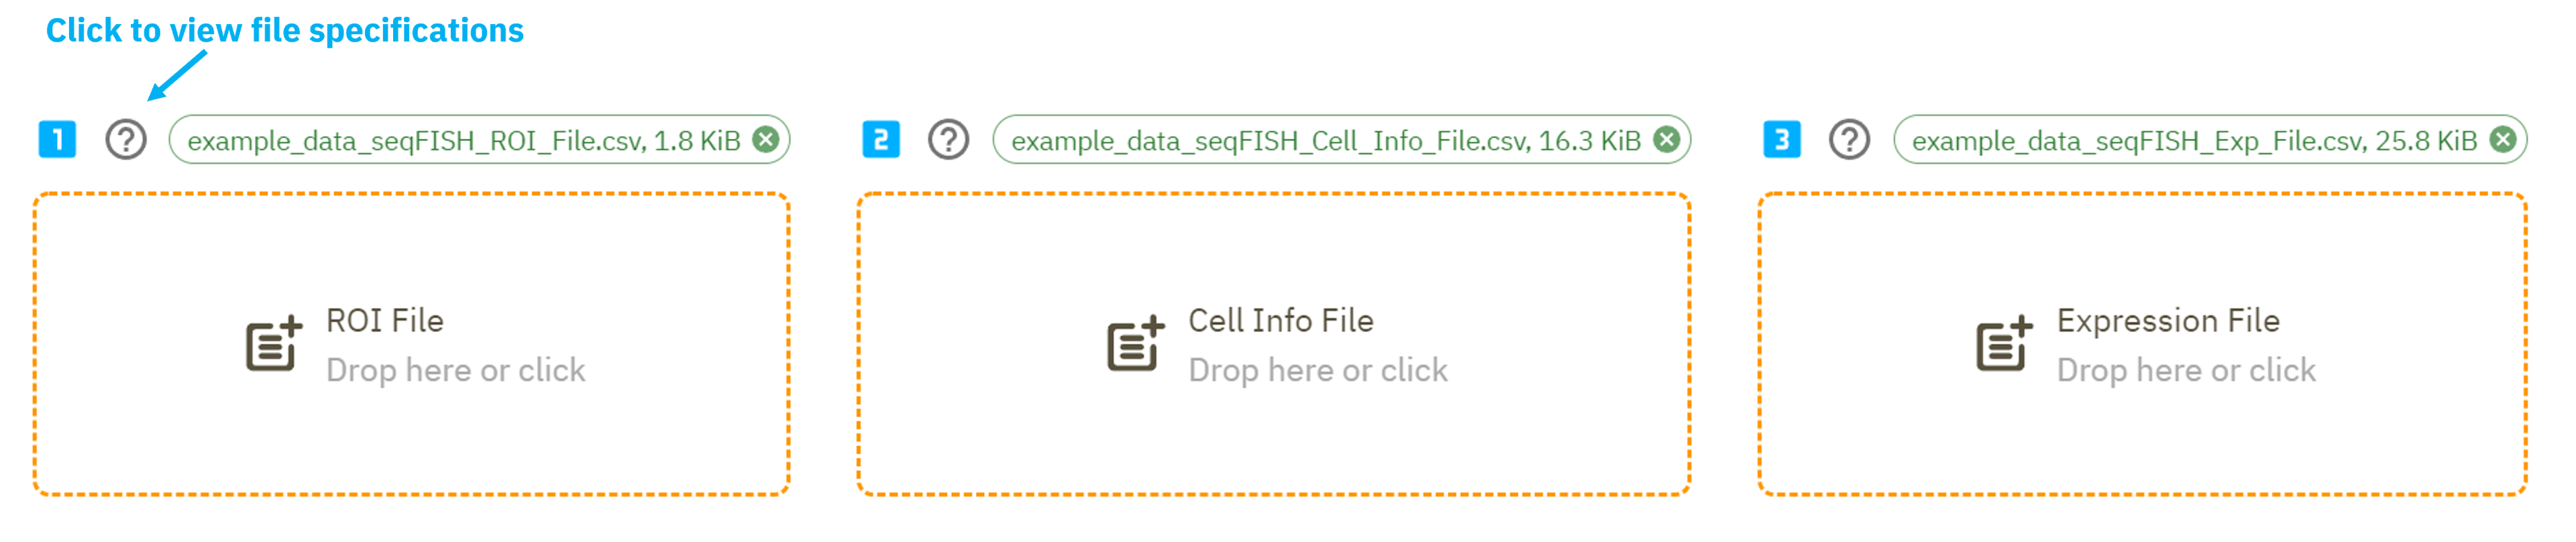
Prepare 3 files
- ROI file: Each line annotates the ROI that the cell belongs to.
- Cell info file: Must have at least 2 columns, coordination X and coordination Y, or you can add an extra column to specify cell type.
- Expression file: Each column is a gene, and the header is the gene name.

Specify a Data ID

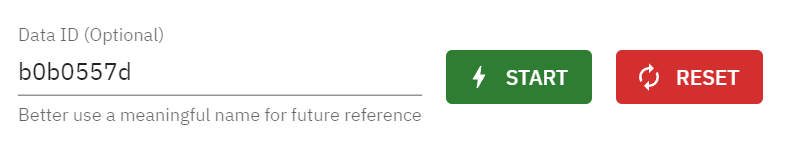
Run the analysis

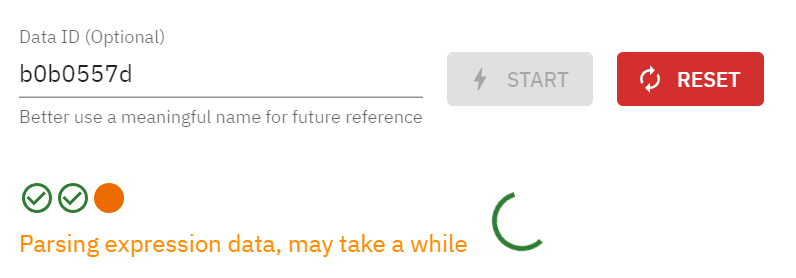
Check your result

What does each analysis do?
Cell components
Proportion of each cell type
CELL TYPE
Simple statistics on the proportion of different cell types
Cell density
Density of different of different cells
CELL TYPE
Simple statistics on the density of different cell types
Cell expression
Marker expression in different cell types
CELL TYPE
Co-expression
Marker co-expression
The expression correlation between two or more markers
Spatial Co-expression
Marker co-expression with spatial information
NEIGHBORS
The correlation between two or more markers expression at cells neighbors
Ripley Statistics
The distribution characteristics at different distance range
CELL TYPE
Few functions can be used profile the distribution of different cells at different distance range
Cell distribution
Distribution pattern for each cell type
CELL TYPE
1) Random
2) Cluster: Cells are aggregated together
3) Evenly distributed: This is very common to see
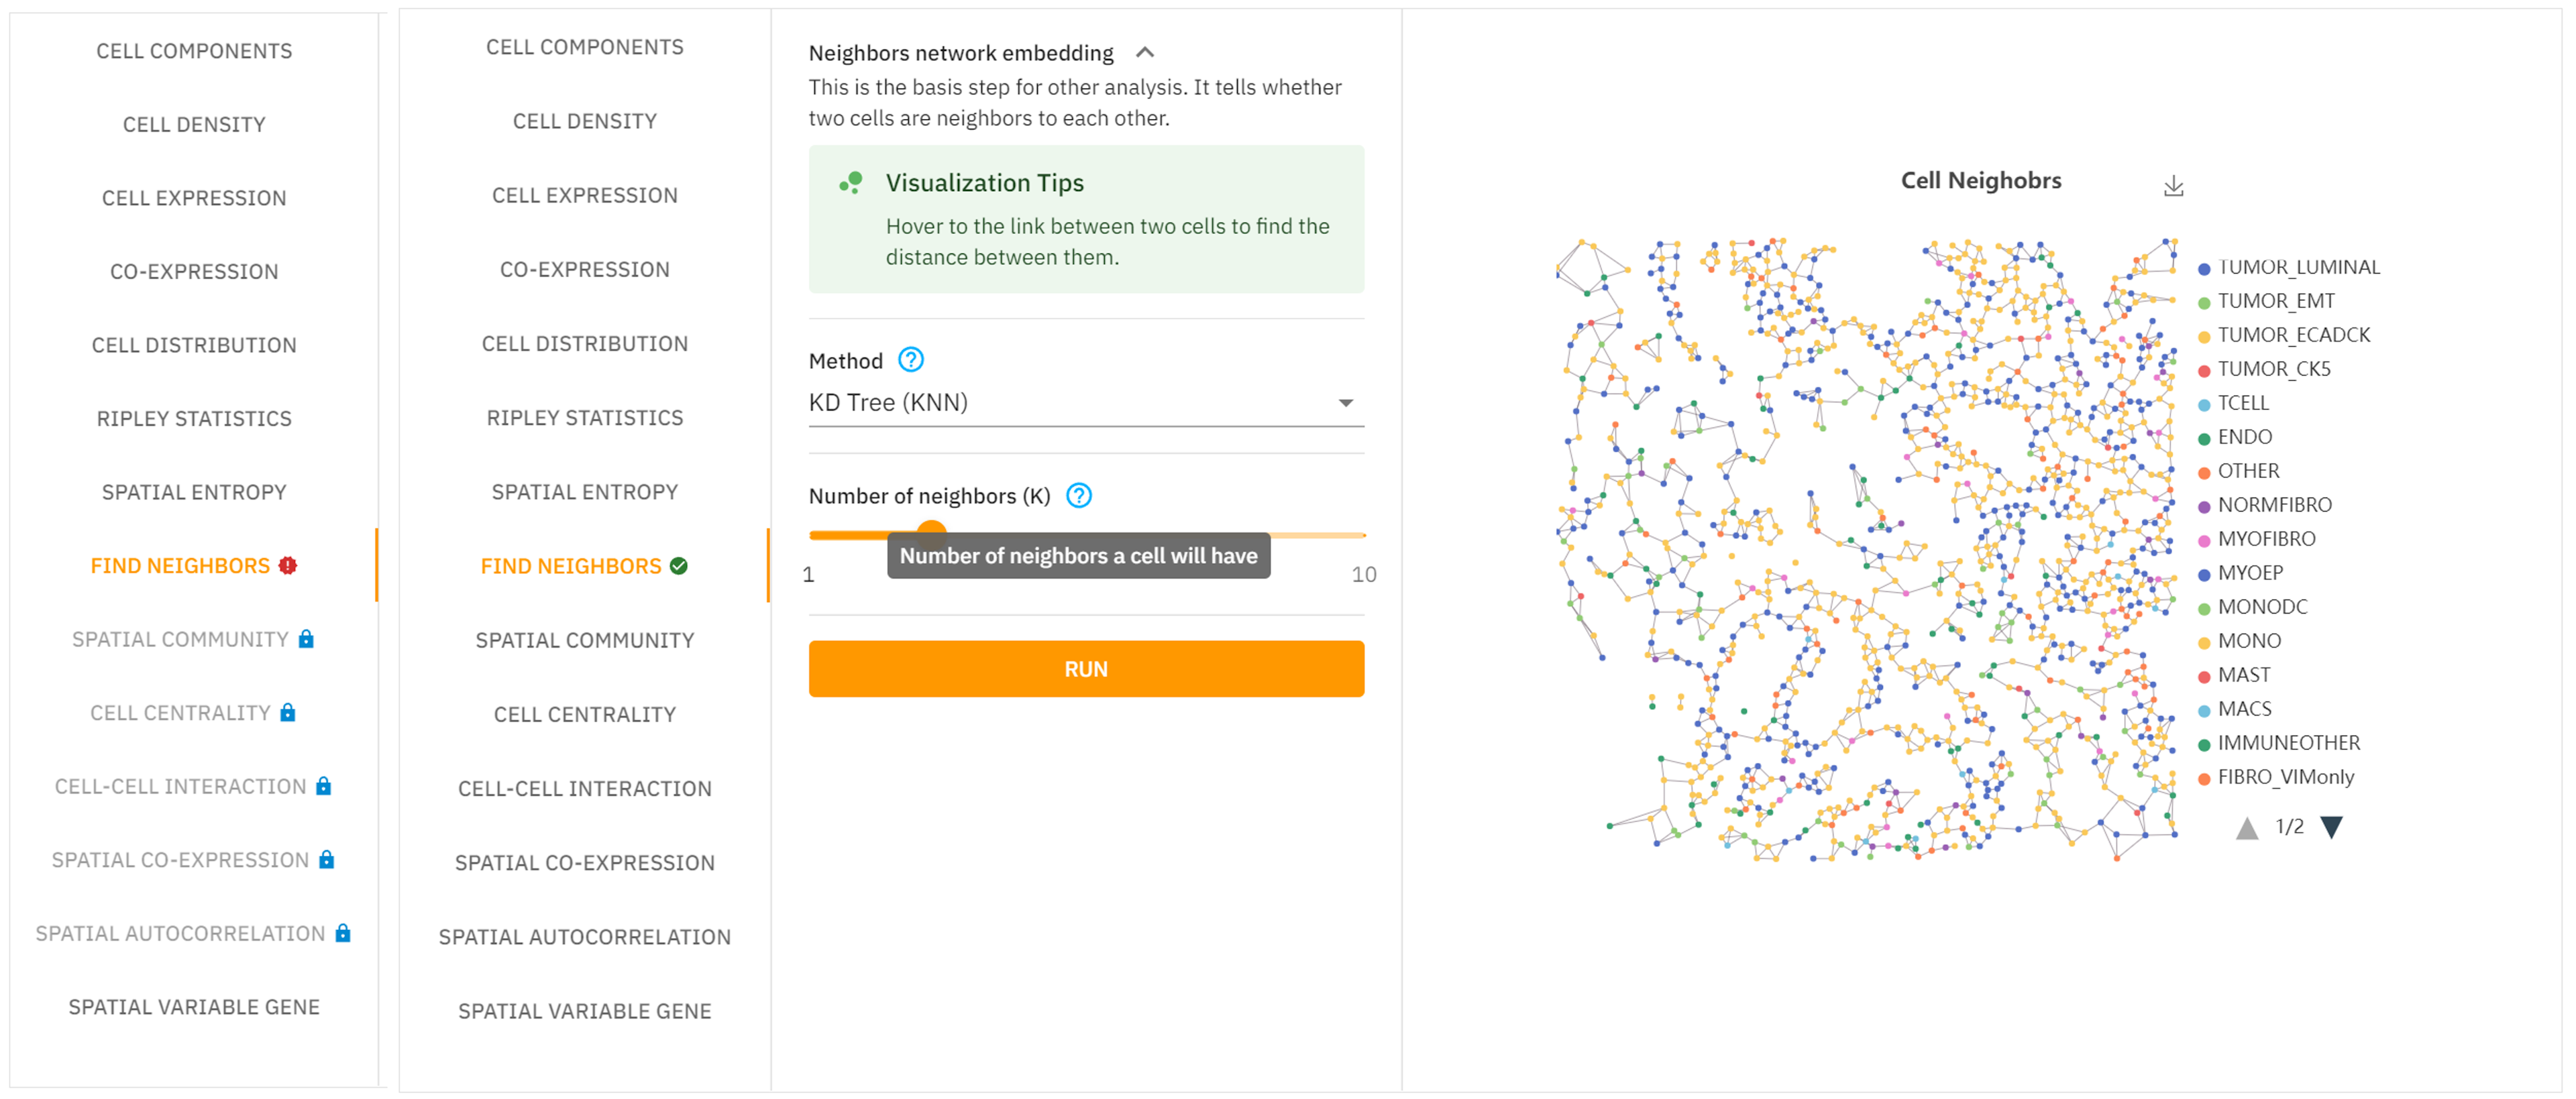
Find neighbors
Get to know the neighbors for each cells
You can know whether two cells are neighbors to each other, in the visualization, two cell will be linked if they are neighbors
Spatial community
Find the cell community based on neighbor graph
NEIGHBORS
Using graph community detection algorithms to cut the graph into different communities.
Cell centrality
How how a cell is connected to other cells
CELL TYPE
NEIGHBORS
Calculate different centrality metrics based on neighbor graph
Cell-Cell interaction
Check if two type of cell tend to stick together
CELL TYPE
NEIGHBORS
Spatial entropy
Evaluation of the tissue heterogeneity with spatial factor
CELL TYPE
Useful to evaluate the heterogeneity within a tissue
Spatial auto-correlation
Correlation between expression and nearby spatial location
NEIGHBORS
Value close to -1 and is significant indicate negative spatial auto-correlation and vice versa.
Spatial variable gene
Whether the gene expression is dependent on spatial location
NEIGHBORS
If a gene is spatial variable, it suggest that spatial factor has certain influence on it's expression